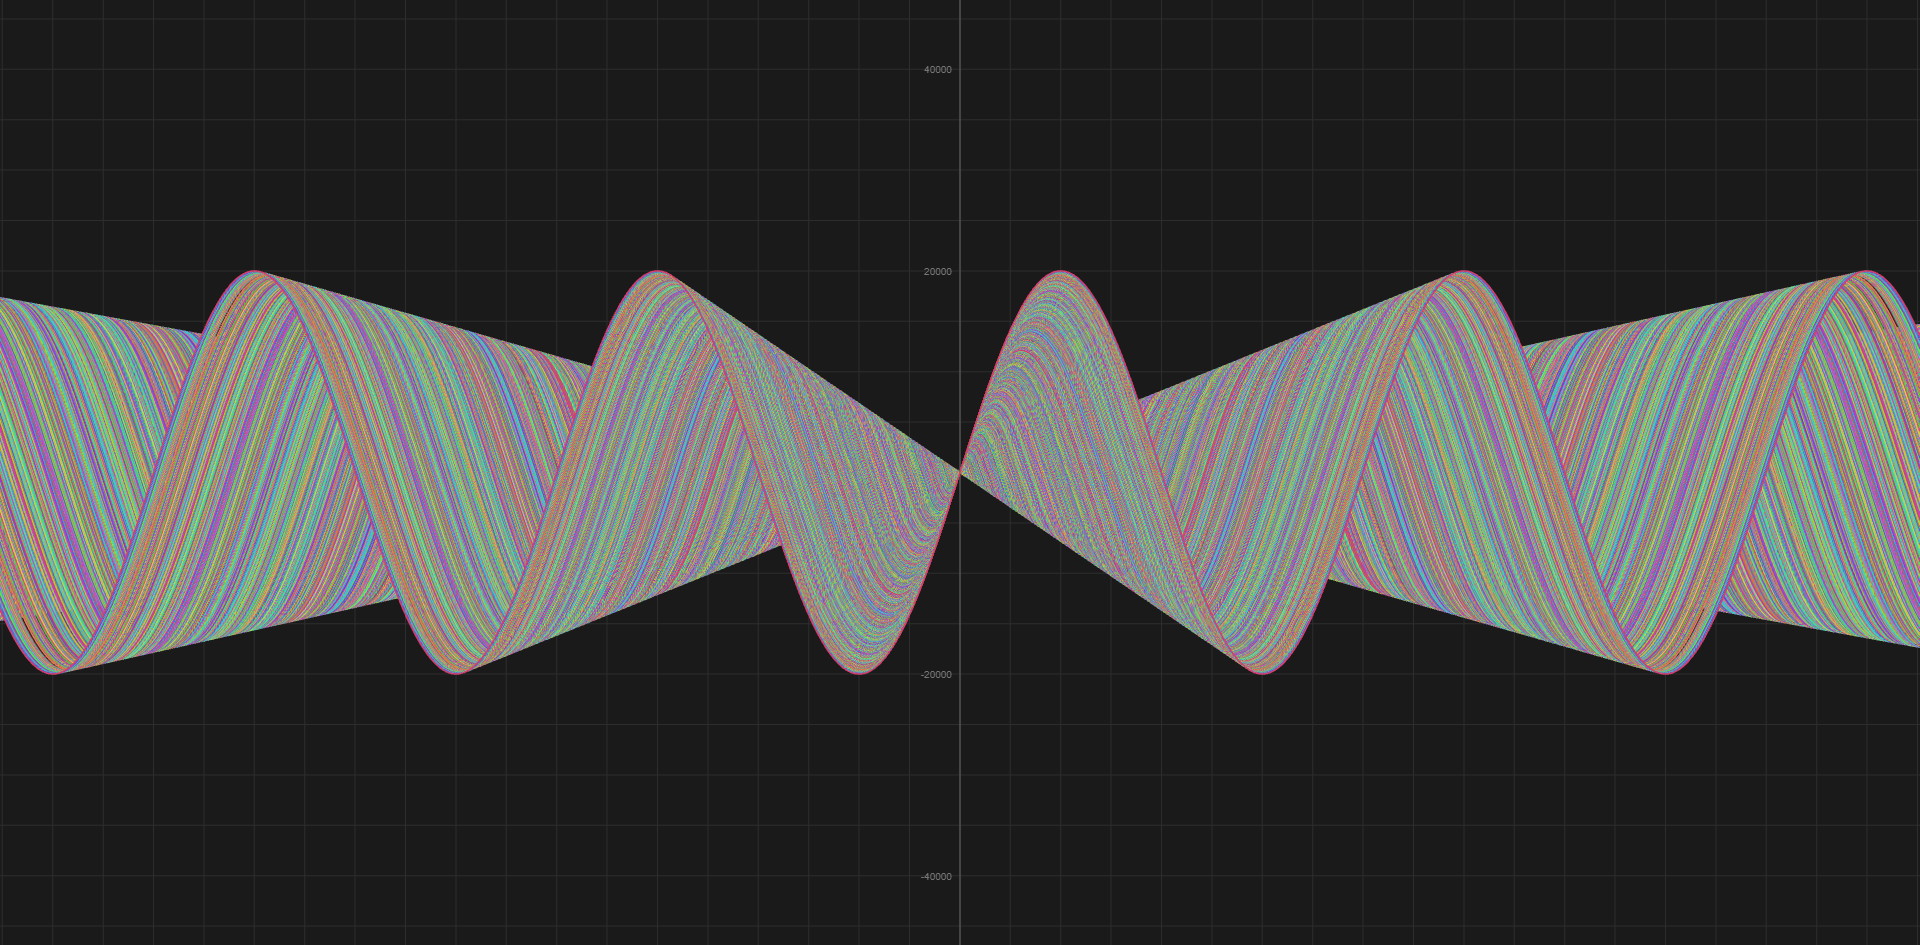
Function Flotter with JS code multi-graphics (prime numbers, pi(x) and special function)
Create your multi 1d graphics!
https://asyncker.github.io/function-plotter-code-multi/index.html
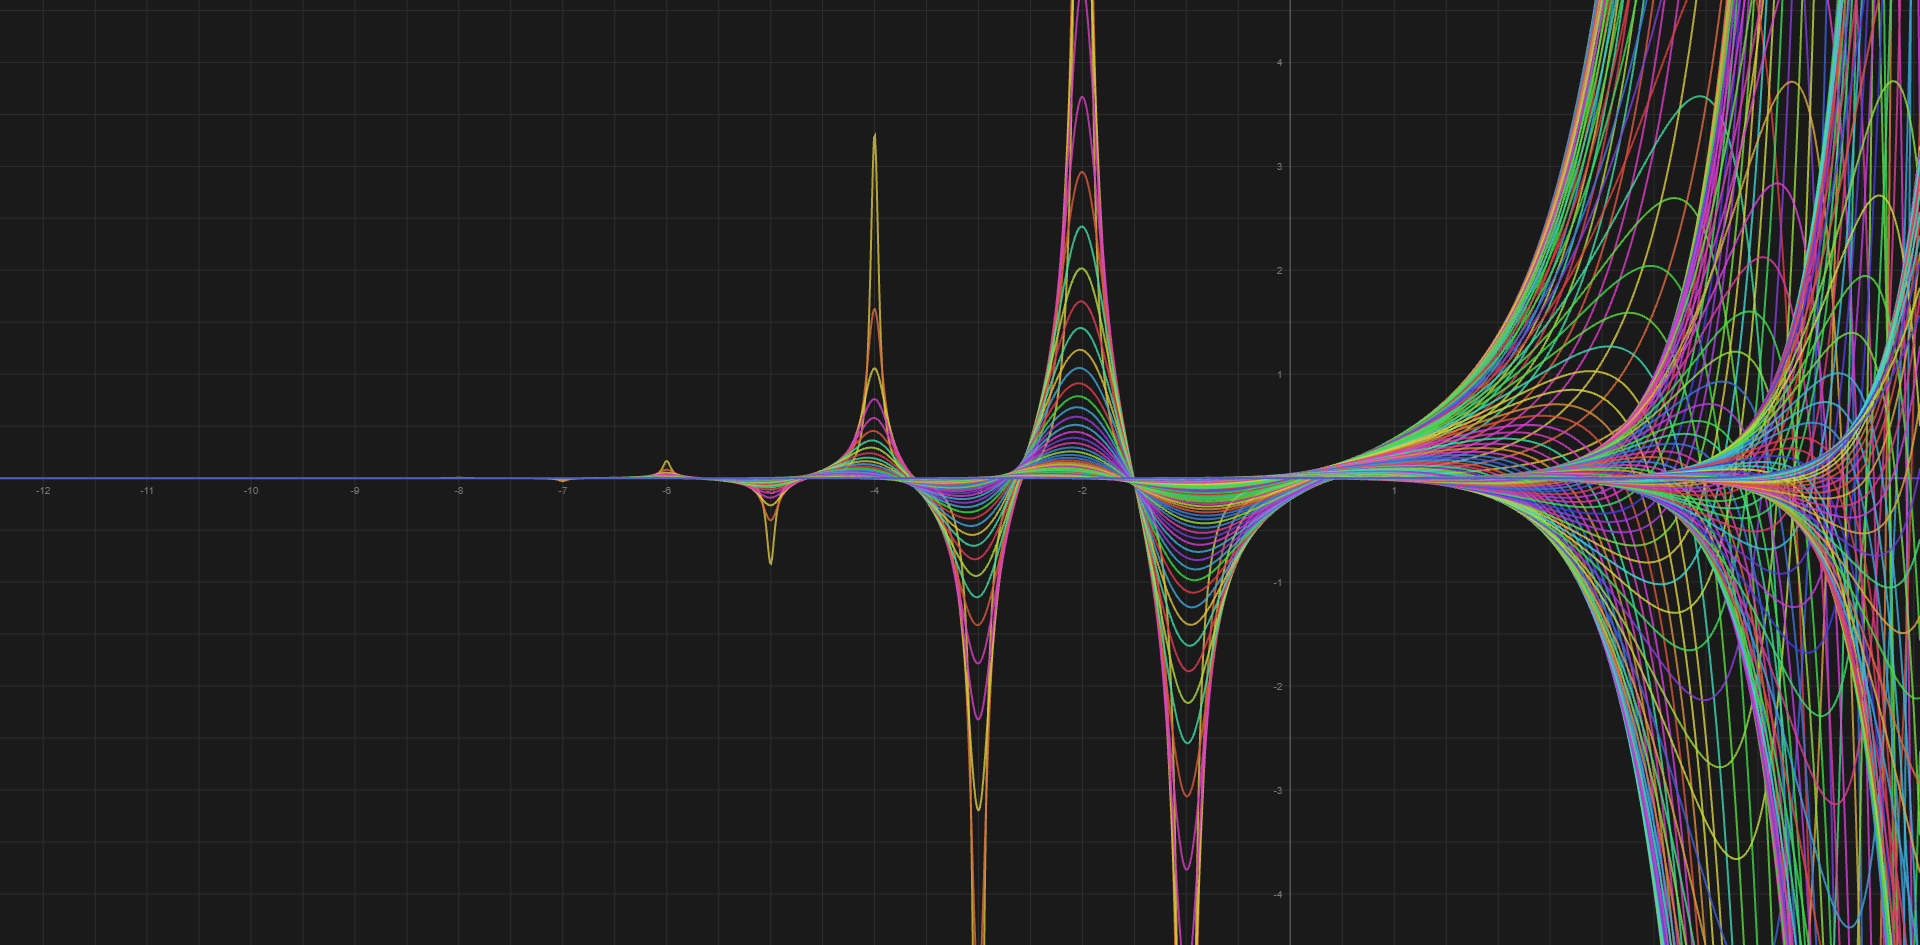
Gamma waves:
for (let i = 0; i < 10.0; i += 0.05) {
  plot(x => cgamma(complex(x, i)).y);
}
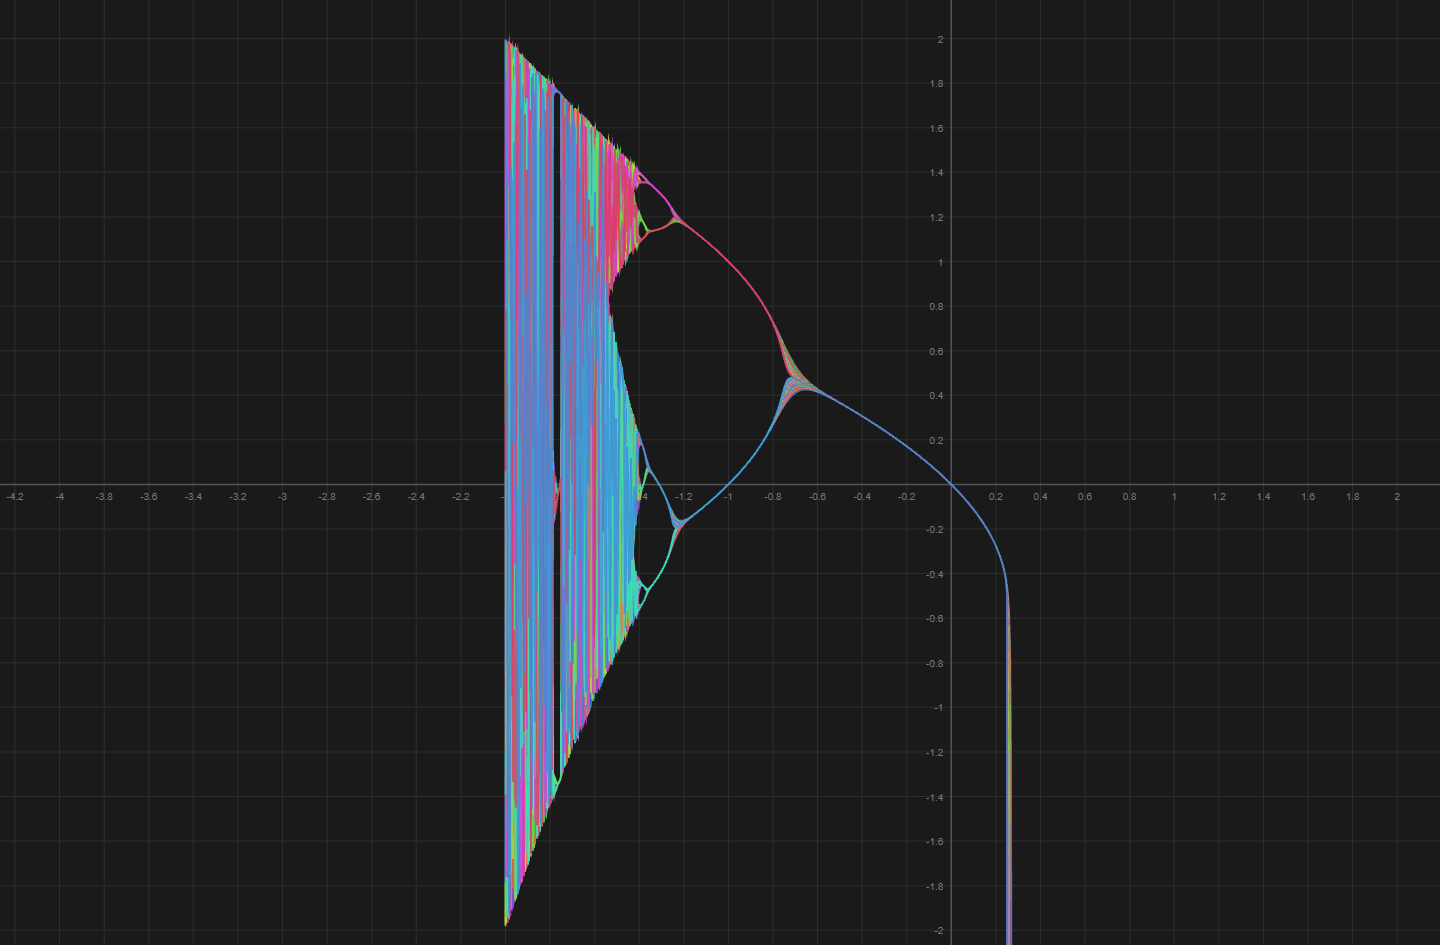
Mandelbrot 1d biffurcation:
function realMandelbrot(c, n) {
  let z = 0;
  for (let i = 0; i < n; i++) {
    z = pow(z, 2) + c; //z = sin(z) + c;
  }
  return z;
}

for (let n = 20; n <= 100; n += 1) {
  plot(x => -realMandelbrot(x, n));
}
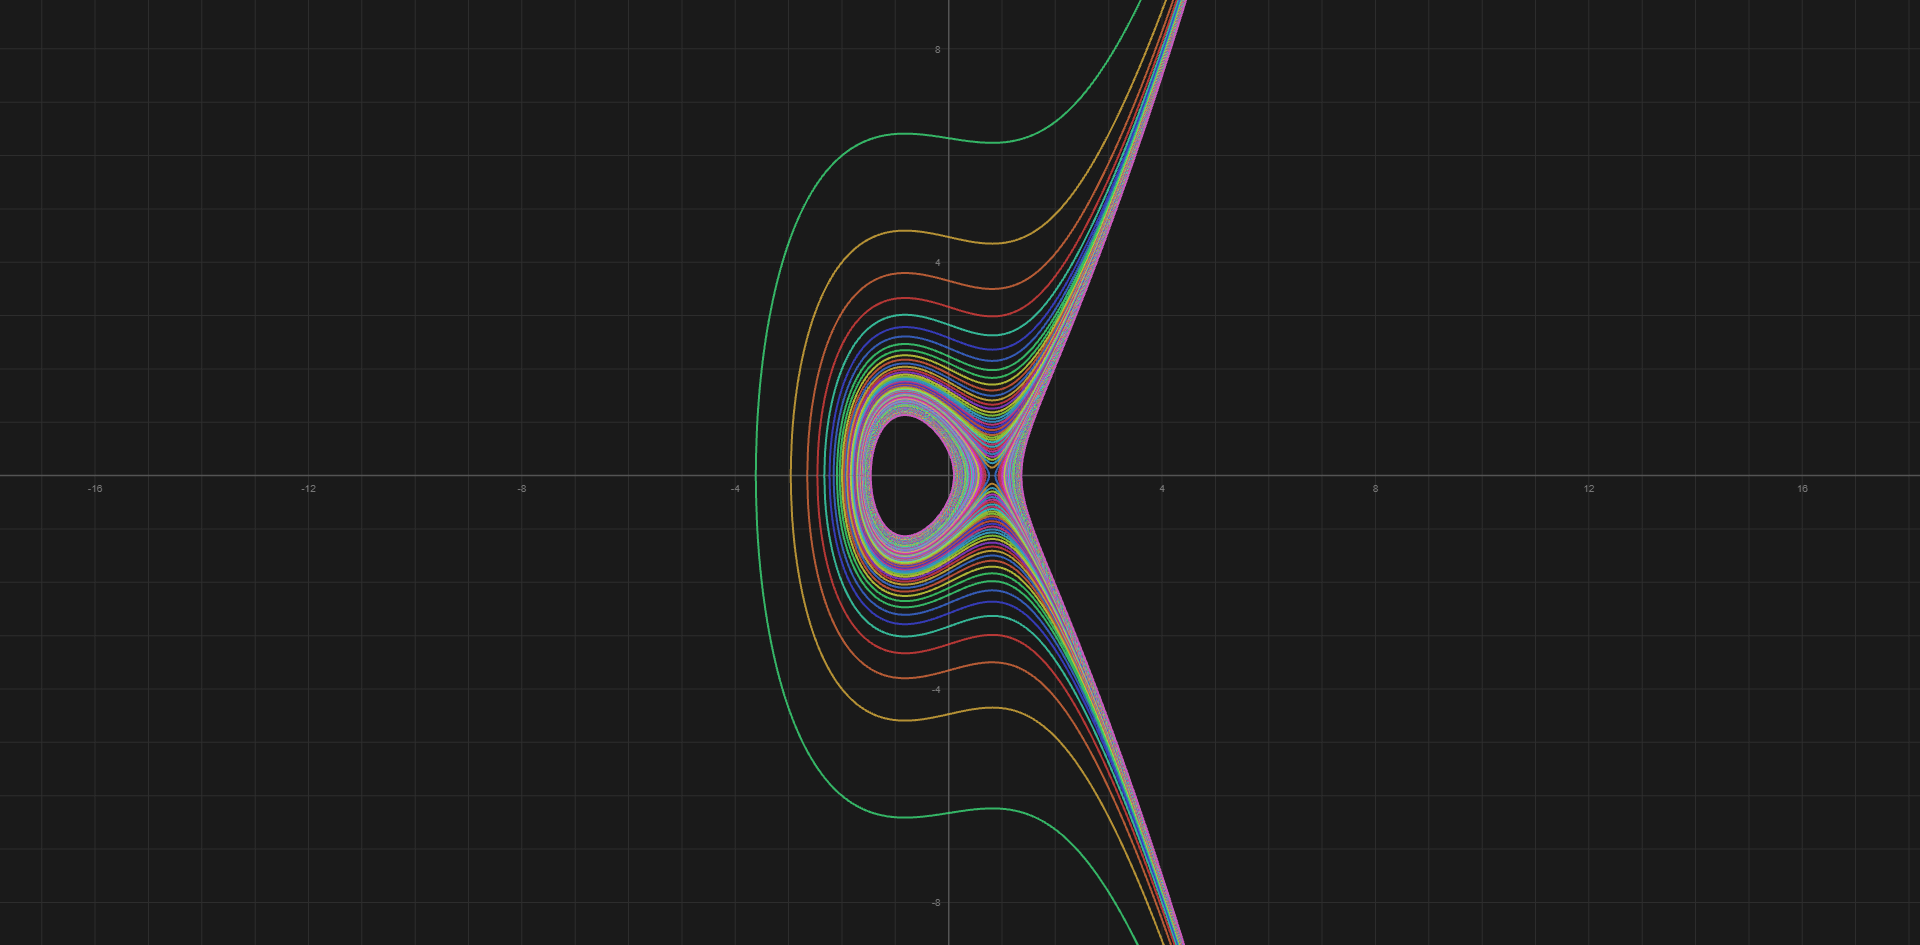
Elliptic curves:
for (let i = 0; i < 10.0; i += 0.05) {
  let ecolor = randomColor();
  plot(x => sqrt(pow(x, 3) - 2 * x + 2.0 / i), { color: ecolor });
  plot(x => -sqrt(pow(x, 3) - 2 * x + 2.0 / i), { color: ecolor });
}
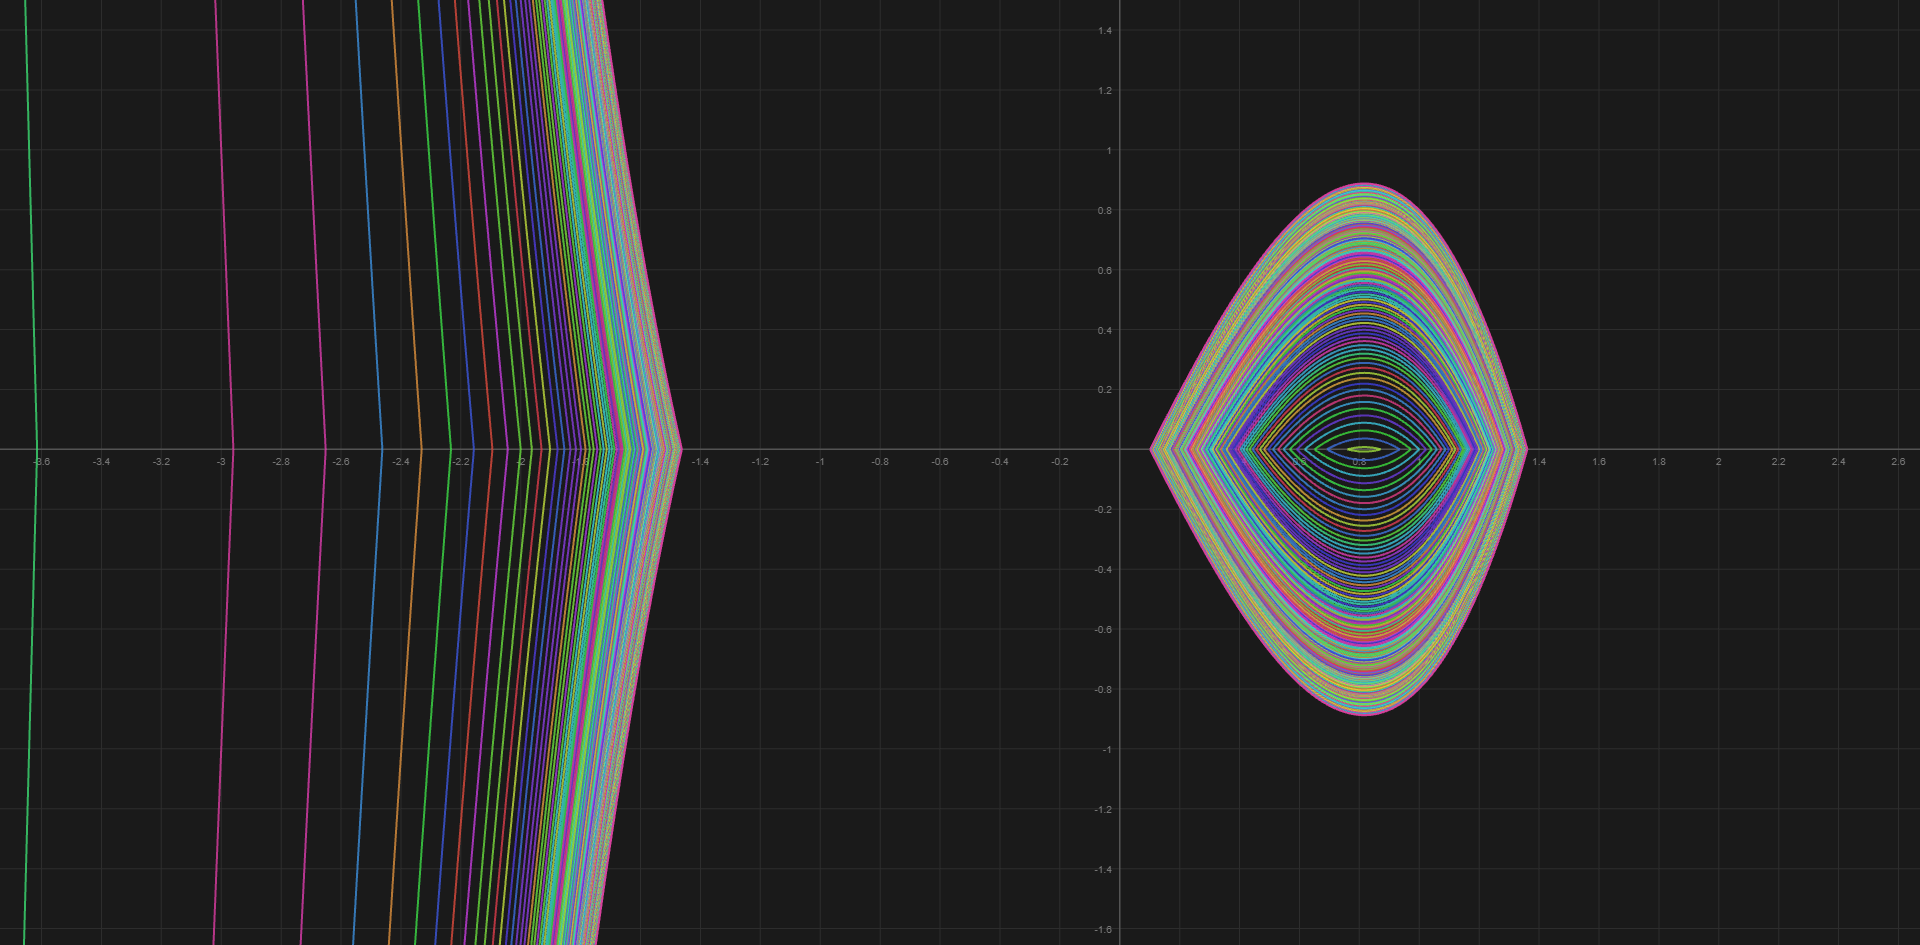
Relu-curves symetry:
for (let i = 0; i < 10.0; i += 0.05) {
  let colorv = randomColor();
  plot(x => +relumin(pow(x, 3) - 2 * x + 2.0 / i), { color: colorv });
  plot(x => -relumin(pow(x, 3) - 2 * x + 2.0 / i), { color: colorv });
}
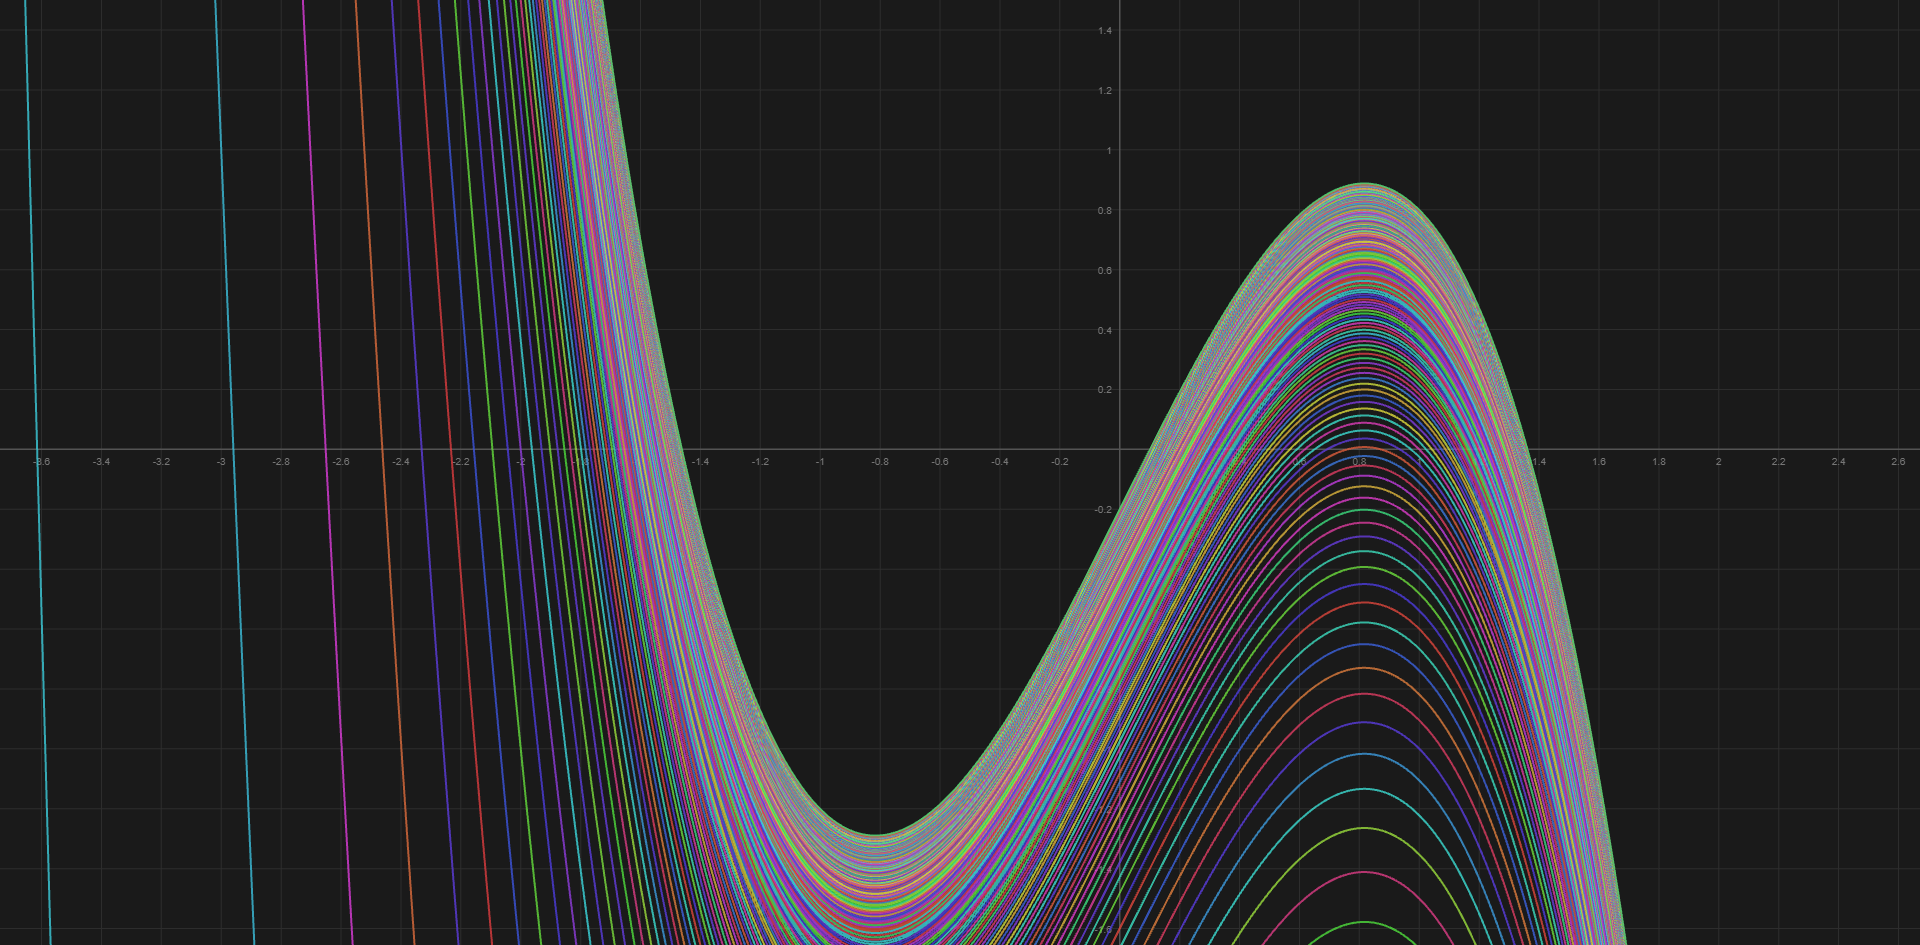
Relu-curves asymetry:
for (let i = 0; i < 10.0; i += 0.05) {
  let colorv = randomColor();
  plot(x => -relumax(pow(x, 3) - 2 * x + 2.0 / i), { color: colorv });
  plot(x => -relumin(pow(x, 3) - 2 * x + 2.0 / i), { color: colorv });
}
Prime waves:
primes = primes(10374);
for (let i = 0; i < primes.length; i++) {
  const p = primes[i];
  const f = (x) => x > p ? sin(x * (PI / p)) * p : 0;
  plot(x => f(x), { color: randomColor() });
}